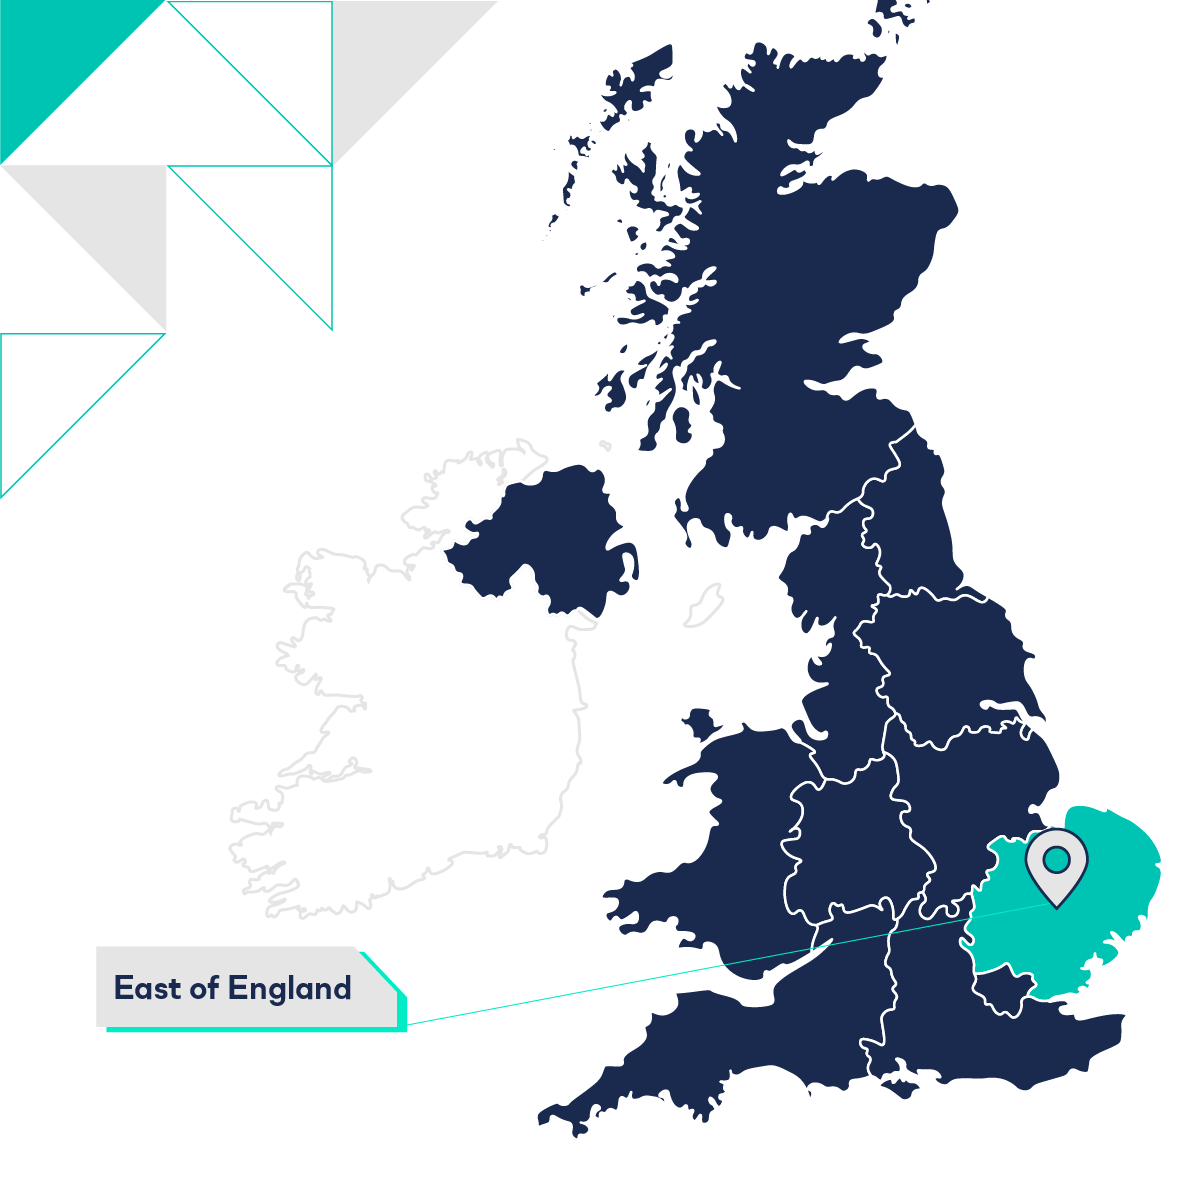
East of England Affordability
Affordability compares the average house price of the area to its annual average earnings. So an affordability of 7 for example, would see house prices being at 7 times annual average earnings.
Affordability for the East of England overall has house prices at 10.27 times average earnings, pricier than England’s overall affordability of 9.29.
View in full screen here
In Suffolk, Babergh is experiencing the least affordable houses with an affordability multiple of 11.38, while Ipswich is the most affordable, with an affordability multiple of 7.98.
In Essex, Epping Forest has the least affordable housing with an affordability multiple of 14.18, while Colchester offers the most affordable houses with a multiple of 9.00.
In Bedfordshire, Bedford is seeing the least affordable houses with an affordability multiple of 10.30, while Luton is the most affordable, with a multiple of 8.93.
In Norfolk, North Norfolk has the least affordable housing with an affordability multiple of 11.60, while Great Yarmouth has the most affordable houses with a multiple of 6.90.
In Hertfordshire, Hertsmere is the least affordable area with an affordability multiple of 15.72, while North Hertfordshire is the most affordable with a multiple of 9.34.
In Cambridgeshire, Cambridge has the least affordable housing with an affordability multiple of 13.45, while Fenland offers the most affordable houses with a multiple of 7.33.
There is no data for affordability for Cumberland.