Introduction: The People
Analysing population density, migration patterns, median age, and income can help you to make data-driven decisions about the type of properties that the local communities most need.
We’ve drilled into some of the recent data from the Office of National Statistics so that you don’t have to.
Population Density
Census data for 2021 puts the South East’s population at 9,280,210 – an increase from the ONS’s 2020 mid-year population estimate of 9,217,265.
If we look back even further, we see a 7.25% population increase over a 10-year period, up from 8,652,784 in 2011. This is higher than the national increase for the same period which was 6.37%.
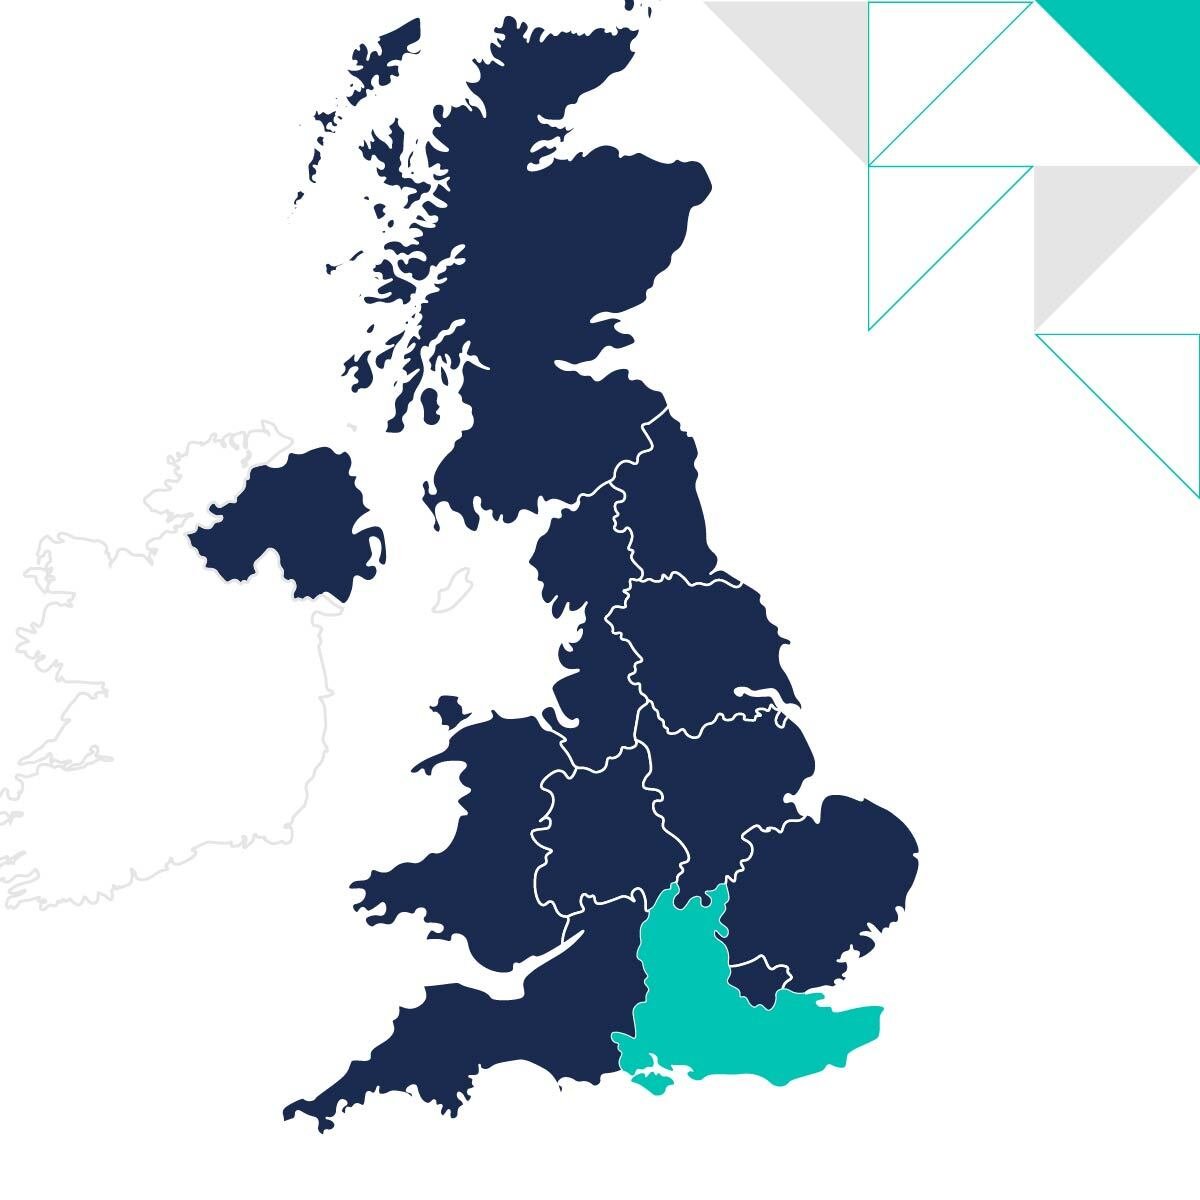
This makes the South East the most populous region in the UK, even higher than London itself (8,799,730), and the third most densely populated region with 487 people per sq km.
If we look at the estimated population projections for the South East, these figures are set to climb even higher. In 2031, there are expected to be 9,623,462 people living in the region. This is an even more significant increase than we’ve seen in the past 10 years, with growth accelerating 4 percentage points to 11.22%.
However, there is still a lot of disparity within the region. For example, outside of London, Portsmouth has the second highest population density in all of the UK and a projected 10-year population growth of 7.2% to 222,978. Noteworthy as this is five times the growth from 2011-2021, which was a relatively restrained 1.3%. Growing demand in the area could present opportunities for developers who are willing to develop in existing dense urban areas – more on this later.
When comparing this to more sparsely populated areas like Chichester (158.4 people per sq km) and West Oxfordshire (161.2 people per sq km), a very different pattern emerges. West Oxfordshire is the fifth largest local authority in the region in terms of square kilometres, so theoretically more land to go after right? Firstly, 37% of the Council Area is affected by Green Belt, SSSI, or AONB, and secondly, the data suggest that demand may not be as strong in this part of the region in the coming decade. In a reversal of what we saw in Portsmouth, the rate of population growth is slowing in West Oxfordshire – with a growth of only 1.1% estimated between 2021-2031.
In terms of projected population, we see some interesting changes anticipated within the South East, for example in both Dover and Oxford. Dover is expected to see the largest population increase in the South East (+13.1%) and Oxford is on track to have the biggest decrease in population (-8%).
Migration Patterns
2021 ONS data shows that net internal migration for the South East was +7,623 persons – meaning that the population increased by a fraction of a percent – 0.08% in fact – as a result of people moving to the South East from other local authorities in the UK. The impact of net international migration is a hundred times less, resulting in only a population change of +77 persons.
This is a pattern we see repeated across the region as the total population change as a result of internal migration is more significant (either positive or negative net migration) than international migration is.
Buckinghamshire had the highest net internal migration of any local authority in the region at +1,339 persons, but the total population was barely impacted by people moving into the area from outside of the UK (+12 persons).
At the opposite end of the spectrum, we have Oxford, which saw its population drop as a result of net internal migration – with a change of -2,204 persons. This could be a result of the poor (bottom quartile) student retention rates that Oxford experiences. Historically, it has been as low as only 20% of students remaining in the city after graduating. Affordability could be the key driving factor – Oxford’s income-to-house price ratio (taking the median income and comparing it to the median house price) is 8.6%, which is comparable to London’s 7.7%.
Age
Age can be a useful indicator of the kind of housing requirements for people living in the area. A younger median age could signal that more apartments or first-time homes are needed. Whereas, the reverse may mean that more senior living properties will be required.
Urban hubs typically have a lower median age as young people are drawn there by job opportunities and the faster pace of life. After the South West, the South East has the highest median age in England at 41.8. Since 2011, this figure has crept up by 1.2 years from 40.6. The proximity to London makes the South East an appealing region for families looking for more green space whilst still remaining within a commutable distance of the capital.
Rother has the highest median age (53.7) in the South East and is part of the UK and Global Networks of Age-Friendly Communities. The coastal setting and commitment to providing welcoming spaces for their senior residents could be part of the lure for the older demographic. Since 2011, the median age in Rother has increased by 3.22 years.
Oxford on the other hand, as a university city, has a much lower median age of 31.9. However, as we saw above there have also been issues with retaining the student community after graduation. In fact, the median age has increased by 1.74 years since 2011 showing that the population there is getting older. There could be an opportunity here to provide more Build to Rent properties for the student and post-graduate communities to increase the retention rate.
Dartford is the only local authority in the South East with a population that is getting younger. The difference in median age is marginal, decreasing from 37.67 in 2011 to 37.17 in 2021. It’s also worth noting that Dartford experienced a 19.6% population increase from 2011 to 2021, and from the decrease in median age it seems that more people are moving into the area. As an outlier from the trend we are seeing across the region, it will be interesting to see what happens here in the future.
Income
Adding income data into the demographic mix can help provide more detail on the type of housing that is needed here – and whether it is likely to be affordable for people already living in the area.
London has the highest median income in the UK, but the South East is close behind with £35,658 reported as the median average earnings in the region for full-time work in 2022. In 2012, this figure sat at £29,461 – a 21% increase over a 10-year period.
Within the South East, Waverley has the highest median income for 2022 in the South East at £44,657 – up from £36,938 in 2012 (20.9% increase). It also has some of the highest house prices in the region as we’ll see later in the report.
Hastings had the lowest median income at £28,667 but has seen a significant increase of 31.5% in the last 10 years.
Taking a shorter view, both Epsom and Ewell, and Dartford have seen large annual percentage changes in median income in just the last year (17.5% and 14% respectively). This paints an even more interesting picture of Dartford as the shifts in both age and income indicate that the demographic landscape of the local authority is changing, and bringing with it the potential for new housing needs.
Related Resources
If you've enjoyed the data insights about demographics in the South East, check out our other reports for the region below: