Introduction
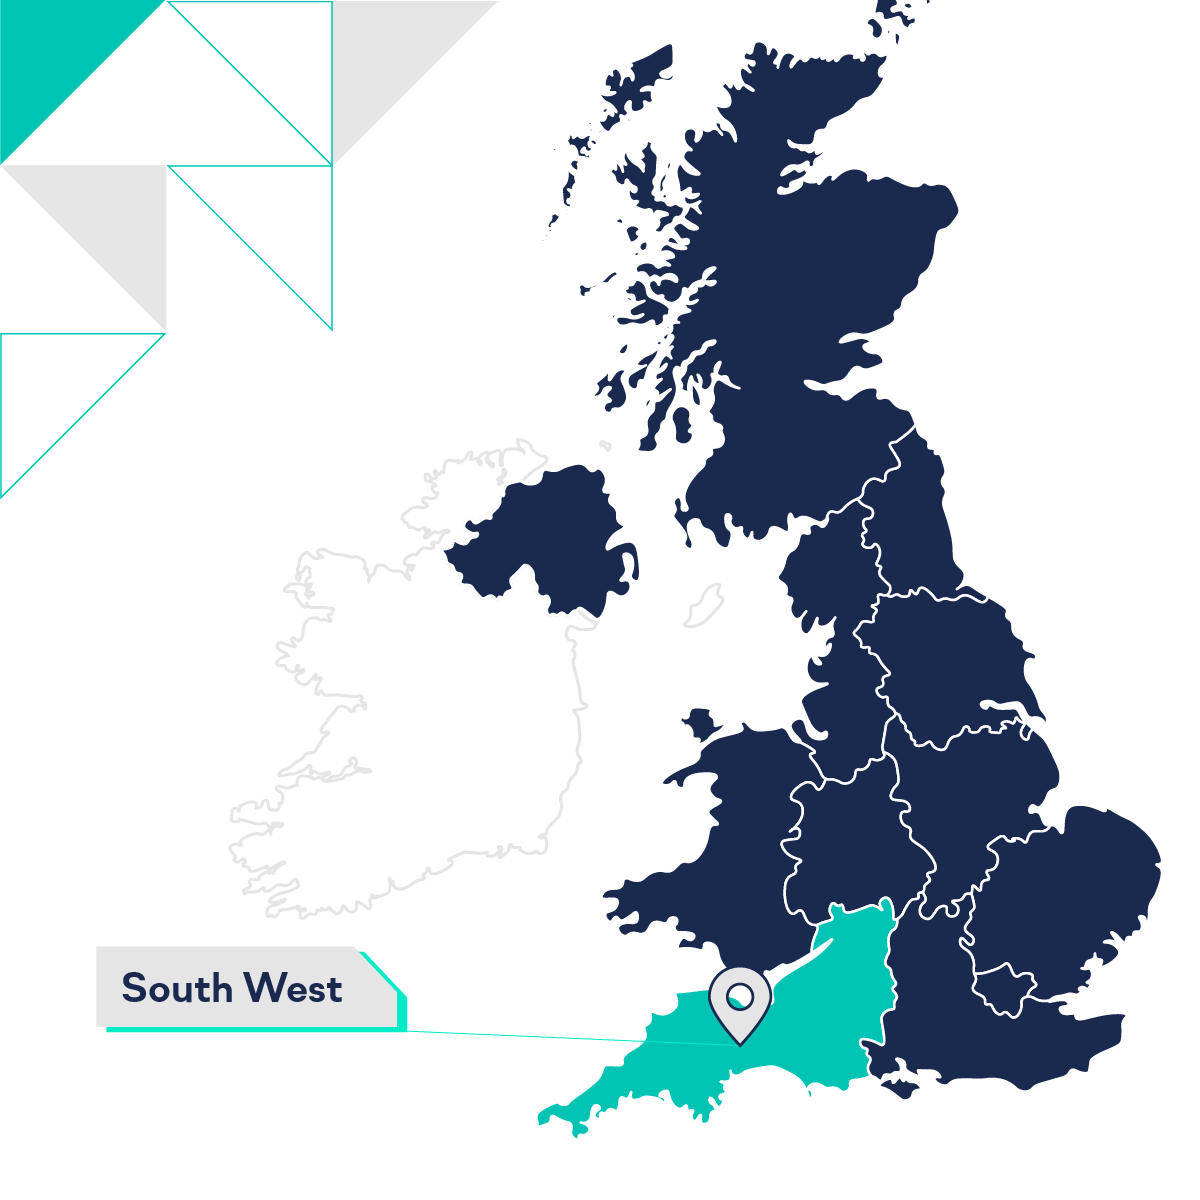
Our Regional Market Report series examines how each local planning authority (LPA) is performing in the South West.
In this report we look at how LPA's housing markets perform over the past ten years, and look at their affordability.

South West House Price Growth Over Ten Years
Over the decade spanning August 2013 to August 2023, the South West has seen its house prices grow from £196,500 to £328,413 – growth of 67.13%. This is in line with England’s overall house price growth of 66.78% (£185,642 to £309,616).
Looking at the counties in the South West, The City of Bristol has the most substantial growth in house prices. While Dorset lags behind the other counties. For reference the South West grew by 67.13% overrall. Here are their growth rates in order:
- Bristol: 89.88%
- Gloucestershire: 71.85%
- Somerset: 71.48%
- Devon: 63.23%
- Cornwall: 62.15%
- Wiltshire: 61.65%
- Dorset: 60.03%
South West House Price Growth over One Year
Between August 2022 and August 2023, the South West saw house prices decline by -1.10% (£332,072 to £328.413). To compare, England's house prices stayed flat, growing by only 0.02% (£309,565 to £309,616).
Looking at a county level, Somerset saw the most growth in house prices year on year – but it was still modest. Dorset saw the biggest decline. For reference, the South West overall, saw house prices decline by -1.10%.
- Somerset: 0.85%
- Bristol: 0.65%
- Devon: 0.39%
- Wiltshire: 0.18%
- Gloucestershire: -0.02%
- Cornwall: -0.55%
- Dorset: -2.94%
South West Affordability
Affordability compares the average house price of the area to its annual average earnings. So an affordability of 7 for example, would see house prices being at 7 times annual average earnings.
Affordability for the South West overall has house prices at 10.35 times average earnings, pricier than England’s overall affordability of 9.32.
In Devon, South Hams is experiencing the least affordable houses with an affordability multiple of 14.48, while Plymouth is the most affordable, with an affordability multiple of 8.06.
In Gloucestershire, the Cotswolds is seeing the least affordable houses with an affordability multiple of 14.49, while the Forest of Dean has the most affordable, with a multiple of 7.87.
In Somerset, Bath and North East Somerset is the least affordable area with an affordability multiple of 12.07 and North Somerset is the most affordable with an affordability of 9.80.
In Wiltshire, Wiltshire LPA has an affordability of 10.15, in line with the region's affordability.
In the City of Bristol, has an affordability of 10.29, in line with the region's affordability.
In Cornwall county, there is only data available for the LPA of Cornwall, which has an affordability of 10.79, a little bit higher than the region's affordability.
In the LPA of Wiltshire (the only LPA we have data for in the county of the same name), the affordability is 10.15 times earnings. In line with the region's affordability.
There is no affordability data for Dorset county at the moment.
Related Resources
If you've enjoyed the data insights about the housing market in the South West, check out our other reports for the region below: