Introduction: The Housing Market
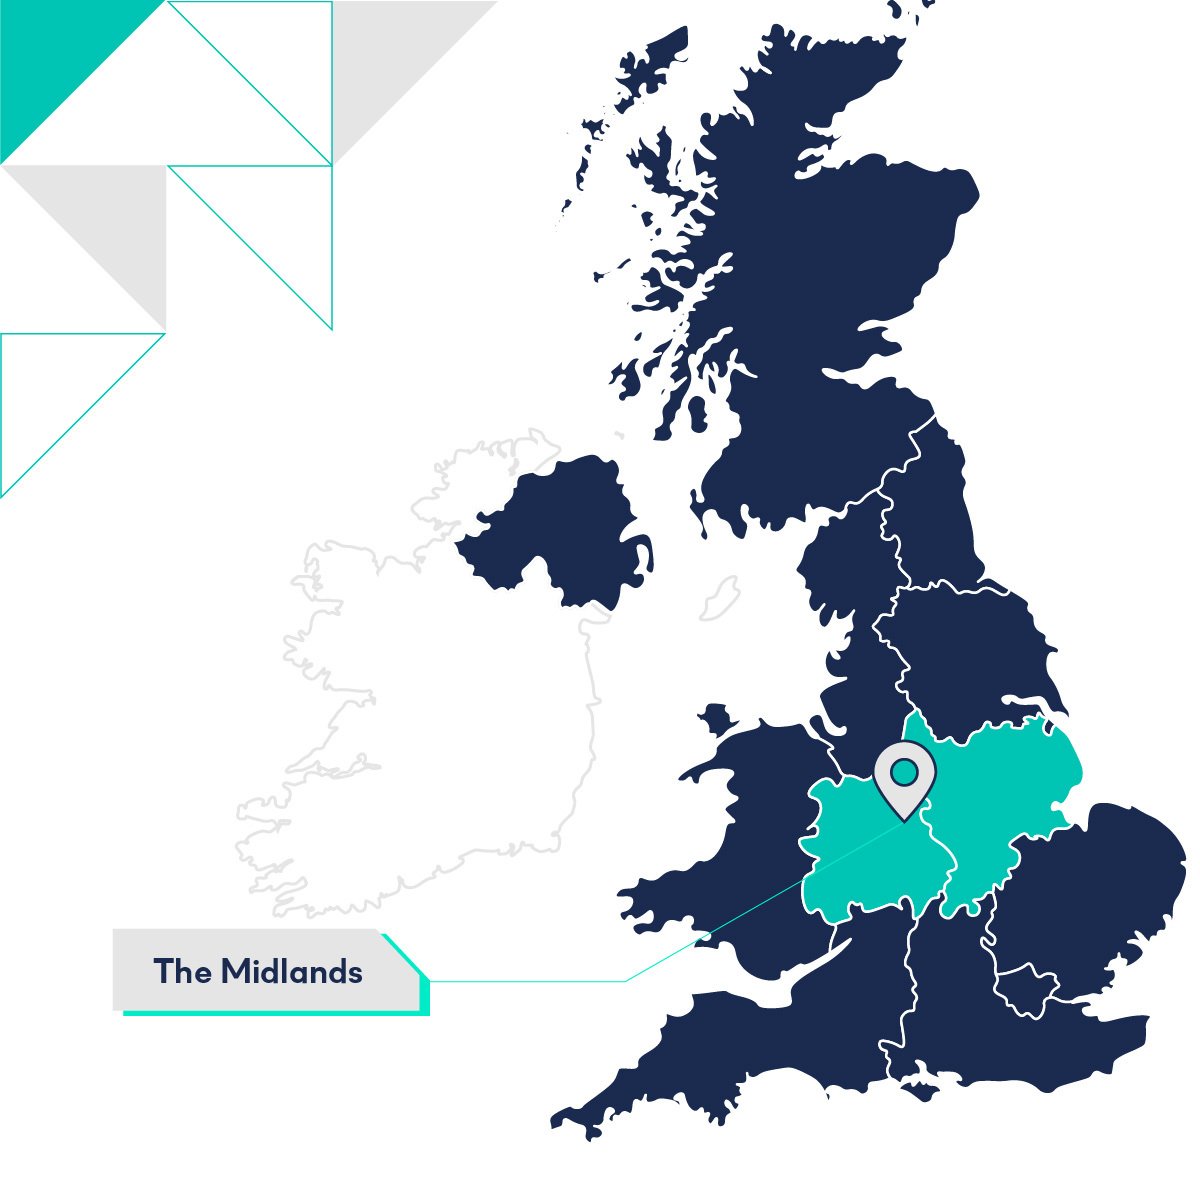
Spanning across the middle of the country, both urban and rural, the West and East Midlands provides a varied housing market.
We take a look at average house prices and housing delivery in both the West and East Midlands.
Average House Prices
WMCA Area
Overall, average house prices in the West Midlands have gone up 9.9% in the last year (January 2022 to January 2023), and 77% over the past decade. In terms of affordability, the West Midlands have house prices that are 8.18 times the average income.
Birmingham doesn’t differ too much from the regional average. 12.1% house price growth in the last year, 81.2% in the past decade. Although affordability is a bit better, at 7.79 times the average income. Comparing housing delivery in 2022 to 2015, there has only been a 0.5% increase in new housing delivery. Birmingham is building homes, but not at a faster pace.
Looking into the rest of the WMCA, Rugby and North Warwickshire have seen the largest house price jumps.
Prices in Rugby grew by 92.8% over ten years, with a new-build premium of 16.03% or £40.76/sqft in 2021. With affordability at 8.78 times income, Rugby is close to the regional average. Supply seems to be matching demand, as Rugby has delivered 135% more homes compared to five years ago.
Prices in North Warwickshire grew by 14.9% in the past year, but with a negative new-build premium of -2.63% or -£4.31/sqft in 2021. Average house prices are 7.99 times the average income in the district, and output in the area has dropped, delivering -11.9% homes compared to five years ago.
Middle performers are Dudley, and Nuneaton and Bedworth. Prices in Dudley grew by 79.1% in the past decade, close to the regional average, with a new-build premium of 21.40% or £48.68/sqft in 2021, and affordability of 7.81 multiples of income. It is delivering fewer homes today compared to five years ago, -69.2% less.
Price performance in Nuneaton and Bedworth is a middle performer for the WMCA for a one year house price change at 11.6%. It had a new-build premium of 35.92% or £69.69/sqft and an affordability of 8.00 multiples of income, and is building more homes: 62.8% more compared to five years ago.
The weakest house price growth in the WMCA were in Stratford-on-Avon and Solihull, but even these still saw growth. Stratford-on-Avon grew 62.6% over the past decade with a new-build premium of 45.75% or £68.18/sqft. House price growth was probably constrained by its affordability – 10.59 times average income – which is above the regional average. Stratford-on-Avon is delivering 17.5% more homes than five years ago.
Solihull is the weakest performer in the WMCA over the past year – 7.3% house price growth between January 2022 and January 2023. It had a new-build premium of 5.36% or £12.94/sqft and a relatively constrained affordability of 9.10 times average income. It has improved its housing delivery compared to five years ago, but barely: 5.7% more homes.
Rest of West Midlands
Looking away from the WMCA, top performers in the West Midlands are Lichfield, with a house price leap of 80.2% in the past ten years, and Malvern Hills, with a house price increase of 15.5% in the past year.
Lichfield had a new-build premium of 10.85% or £29.83/sqft in 2021, and an affordability of 9.07 times average income. Supply is matching demand, with Lichfield delivering 34.6% more homes in 2022 than in 2017.
There is no data for the new-build premium for Malvern Hills, but its house price growth is interesting considering that affordability seems to be problematic with average house prices at 11.25 time average income, some of the highest in the West Midlands (only Wychavon is higher at 11.77 times average income). For comparison, Greenwich in London had an affordability of 11.67 times average income in December 2022, and London as a whole had an affordability of 13.79 times average income. Housing delivery has also dropped off in Maven Hills where they are delivering -10.5% fewer homes than five years ago.
In the West Midlands, the weakest performing LPAs outside the WMCA were Stafford at 56.9% growth in the past decade, a new-build premium of 8.04% or £21.28/sqft, with an affordability of 7.67 times average income. Price growth here may be driven by constrained supply – Stafford delivered -41.4% fewer homes in the past five years.
South Staffordshire also saw weak house price growth in the past year, at 5.25%, but was middle of the table for 10 year house price growth, suggesting house prices are slowing in this LPA. It had a new-build premium of 7.30% or £23.09/sqft, and an affordability of 8.77 times average income. Contrasting Stafford, South Staffordshire has vastly improved its housing delivery, delivering 107.8% more homes in 2022 than in 2017.
Urban East Midlands
Overall the East Midlands saw house price growth of 82.6% in the past ten years, and almost a tenth of that in the past year – 8.6%. It has an affordability of 8.13 times average income.
Looking at the big urban centres in the East Midlands, for ten year house price growth the order goes:
- Nottingham – 97.6%
- Leicester – 94.1%
- Derby – 71.3%
Over the past year, Derby has clearly been making moves, moving to the top of this list:
- Derby – 13.9%
- Nottingham – 13.4%
- Leicester – 10.2%
Nottingham had a new-build premium of 22.36% or £56.58/sqft and an affordability less than the regional average at 7.18 times average income. It delivered 23.6% in 2022 compared to 2017.
Leicester on the other hand, delivered -56.9% fewer homes over the past five years, and had an affordability slightly higher than the regional average at 8.53 times average income. It had a new-build premium of 9.79% or £22.74/sqft in 2021.
Derby has the best affordability of the three at 6.77 times average income, but is delivering fewer homes, with a delivery change of -13.5% between 2017 and 2022. It had a new-build premium of 28.00% or £57.80/sqft.
Rest of East Midlands
Driving house prices in the rest of the East Midlands is Gedling, with a ten year price growth of 93.1% and North East Derbyshire with a 19.9% house price growth in the past year.
Gedling had a negative new-build premium of 5.15% or -£11.83/sqft, an affordability of 8.36 times average income, and has been delivering more homes: 50.6% more homes compared to its performance five years ago.
North East Derbyshire has a similar affordability of 8.40 times average income, delivering 40.2% more homes in 2022 than in 2017, but a positive new-build premium of 40.95% or £74.94/sqft.
In the middle of the table, for both ten year house price growth, and one year house price growth is Mansfield. Over the past ten years, house prices grew 80.6%, close to the East Midlands overall average. In the past year, house prices have grown 11.2%, slightly higher than the regional average.
Houses are comparatively affordable in Mansfield, with prices being 6.53 times the average income for the area. It held a new-build premium of 6.69% or £14.73/sqft, and has delivered 52.7% more homes in 2022 compared to 2017.
The weakest performers in the rural East Midlands are North East Lincolnshire (56.7% over ten years) and Bassetlaw (4.2% over one year). They both held strong new-build premiums in 2021, with North East Lincolnshire having a premium of 40.95% or £74.94/sqft, and Bassetlaw having a premium of 51.40% or £108.45/sqft.
North East Lincolnshire is relatively affordable compared to the East Midlands average, with an affordability of 5.27 times average income. It is delivering more homes compared to 2017, 181.7% more homes. Bassetlaw also has a relatively good affordability for buyers and lenders at 6.95 multiples of income. It delivered 39.0% more homes over the past five years.
Housing Delivery
For housing delivery we looked at delivery per capita, or how many homes a LPA has delivered per 1000 people per year, on average over the past five years. We also looked at population projections, and calculated how many new homes one can expect to be delivered over the next ten years based on historic delivery and population projections.
This isn’t based on how many homes are needed. Our projections are based on the previous average delivery of the LPA. This assessment means we’re looking at previous performance of an LPA, how it has handled new housing and population growth with all its individual obstacles and challenges, and what we can expect in the future (assuming housing delivery stays constant and correlates with population growth).
This measure, as any measure does, has its limitations, but provides an interesting yardstick as we still await the government’s latest Housing Delivery Test.
WMCA Area
The West Midlands overall delivered 3.87 new homes per 1000 people per year, and at the previous pace of delivery can be expected to deliver 24,580 new homes over the next ten years for its projected population growth of 6.8% to 6.36 million people (from 5.95 million).
Birmingham is performing worse than the regional average, delivering 3.11 new homes per 1000 people per year (which we’ll shorten to new homes per capita for readability). At this pace it will deliver only 3,730 new homes for its projected population change of nearly 55,000 more people by 2031. The good news is that Birmingham is projected to grow at 4.8% over the next decade, less than the 6.6% growth it experienced over the past decade.
Using this measure, the best LPA at housing delivery in the WMCA is Stratford-on-Avon, delivering 9.65 new homes per capita. For its projected population growth, it looks set to deliver 1,446 homes in the next ten years.
Middle of the table in the WMCA is Coventry, with a housing delivery of 4.21 new homes per capita. For its projected ten year population growth, it looks set to deliver 1,782 homes at historic delivery.
Dudley is the weakest at housing delivery per capita in the WMCA. It delivered 1.85 new homes per 1000 per capita. At this pace, it will deliver 626 new homes for its projected population growth over the next ten years
Rest of West Midlands
Leaving the WMCA, Wychavon has been a star performer at housing delivery, providing 6.99 new homes per capita, nearly twice that of the West Midlands overall. For its projected population growth, we project it will deliver 1,044 new homes over the next ten years.
Herefordshire stands in the middle of the rest of the West Midlands, with a delivery of 4.32 new homes per capita, and we can expect it will deliver 902 new homes over the next ten years.
The weakest performer in the rest of the West Midlands is Staffordshire Moorlands, with a delivery of 1.89 new homes per capita. With a population growth of 1,000 people in the next decade, we can expect it will deliver 189 new homes.
Urban East Midlands
Using this measure the East Midlands was better than the West Midlands at housing delivery, building 4.37 new homes per capita. With its projected growth of 340,000 people over the next decade, we can expect the region to build 22,823 new homes based on historic delivery.
For the urban East Midlands, housing delivery in order goes:
- Nottingham – 4.81 new homes per capita
- Leicester – 3.65 new homes per capita
- Derby – 2.42 new homes per capita
Based on historic delivery and population projections, over the next decade we can expect them to build:
- Nottingham: 1,679 new homes
- Leicester: 1,380 new homes
- Derby: 641 new homes
Nottingham is the only city in the East Midlands that is performing above the regional rate of delivery, suggesting that there are significant urban constraints to housing delivery.
Rest of East Midlands
Going to the rural East Midlands, South Derbyshire has been delivering 10.04 new homes per capita, and we can expect them to deliver 1,244 new homes over the next decade.
Middle of the table for this measure is Blaby, with a delivery of 4.26 new homes per capita, close to how the region overall performs. We can expect 502 new homes over the next ten years based on projections and historic delivery.
The weakest performer is North East Lincolnshire at 1.92 new homes per capita, and we can expect a projected delivery of 306 new homes over the next decade.
Related Resources
If you've enjoyed the data insights about the housing market in the South East, check out our other reports for the region below:
- The Midlands: Demographics, Population Density and Migration Patterns
- The Midlands: Land Constraints
- The Midlands: Strategic Land
- The Midlands: Determination Periods, Approval and Overturn Rates