
The Government has released new data about changes to the extent of Green Belt, although this information is yet to be made available in the Government’s data centre, it’s already available in LandInsight.
The Official release is available here, we’ve had a look beyond the headlines to see what this new information actually means.
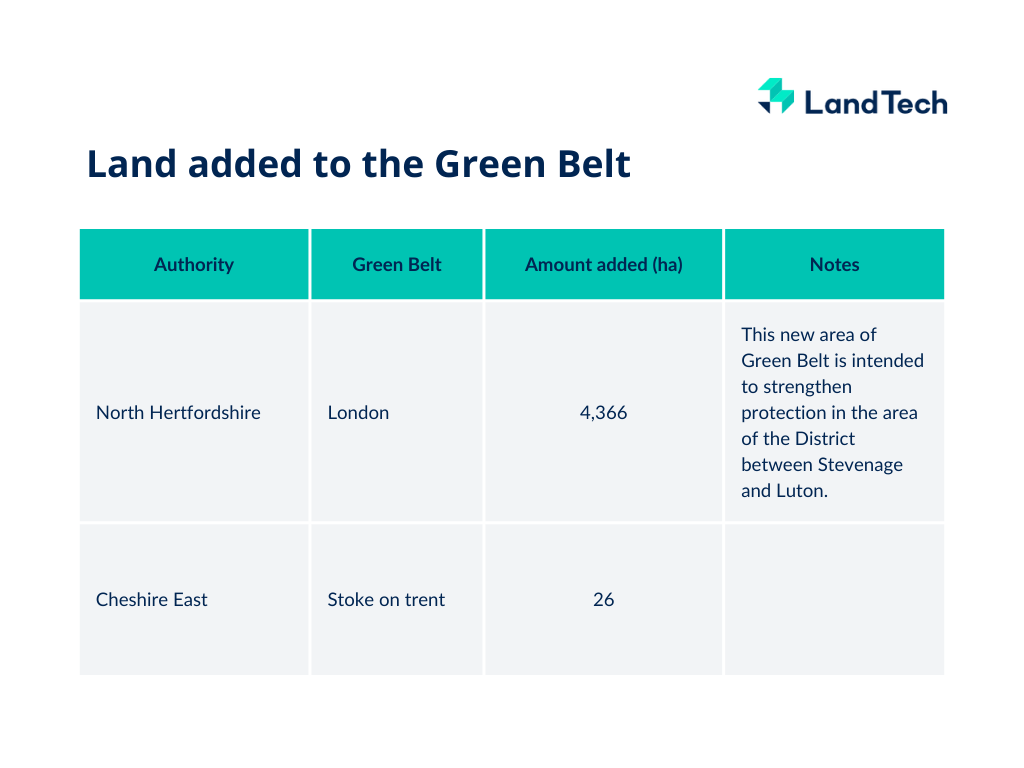
Where has Green Belt been added and released?
Overall, there has been a net increase in green belt coverage, and this was widely reported when the data was released in October. A big driver of the net increase of Green Belt land was a large addition to the Metropolitan Green Belt in North Hertfordshire and a smaller addition to the Green Belt around Stoke on Trent in Cheshire East.
Source: Gov.uk
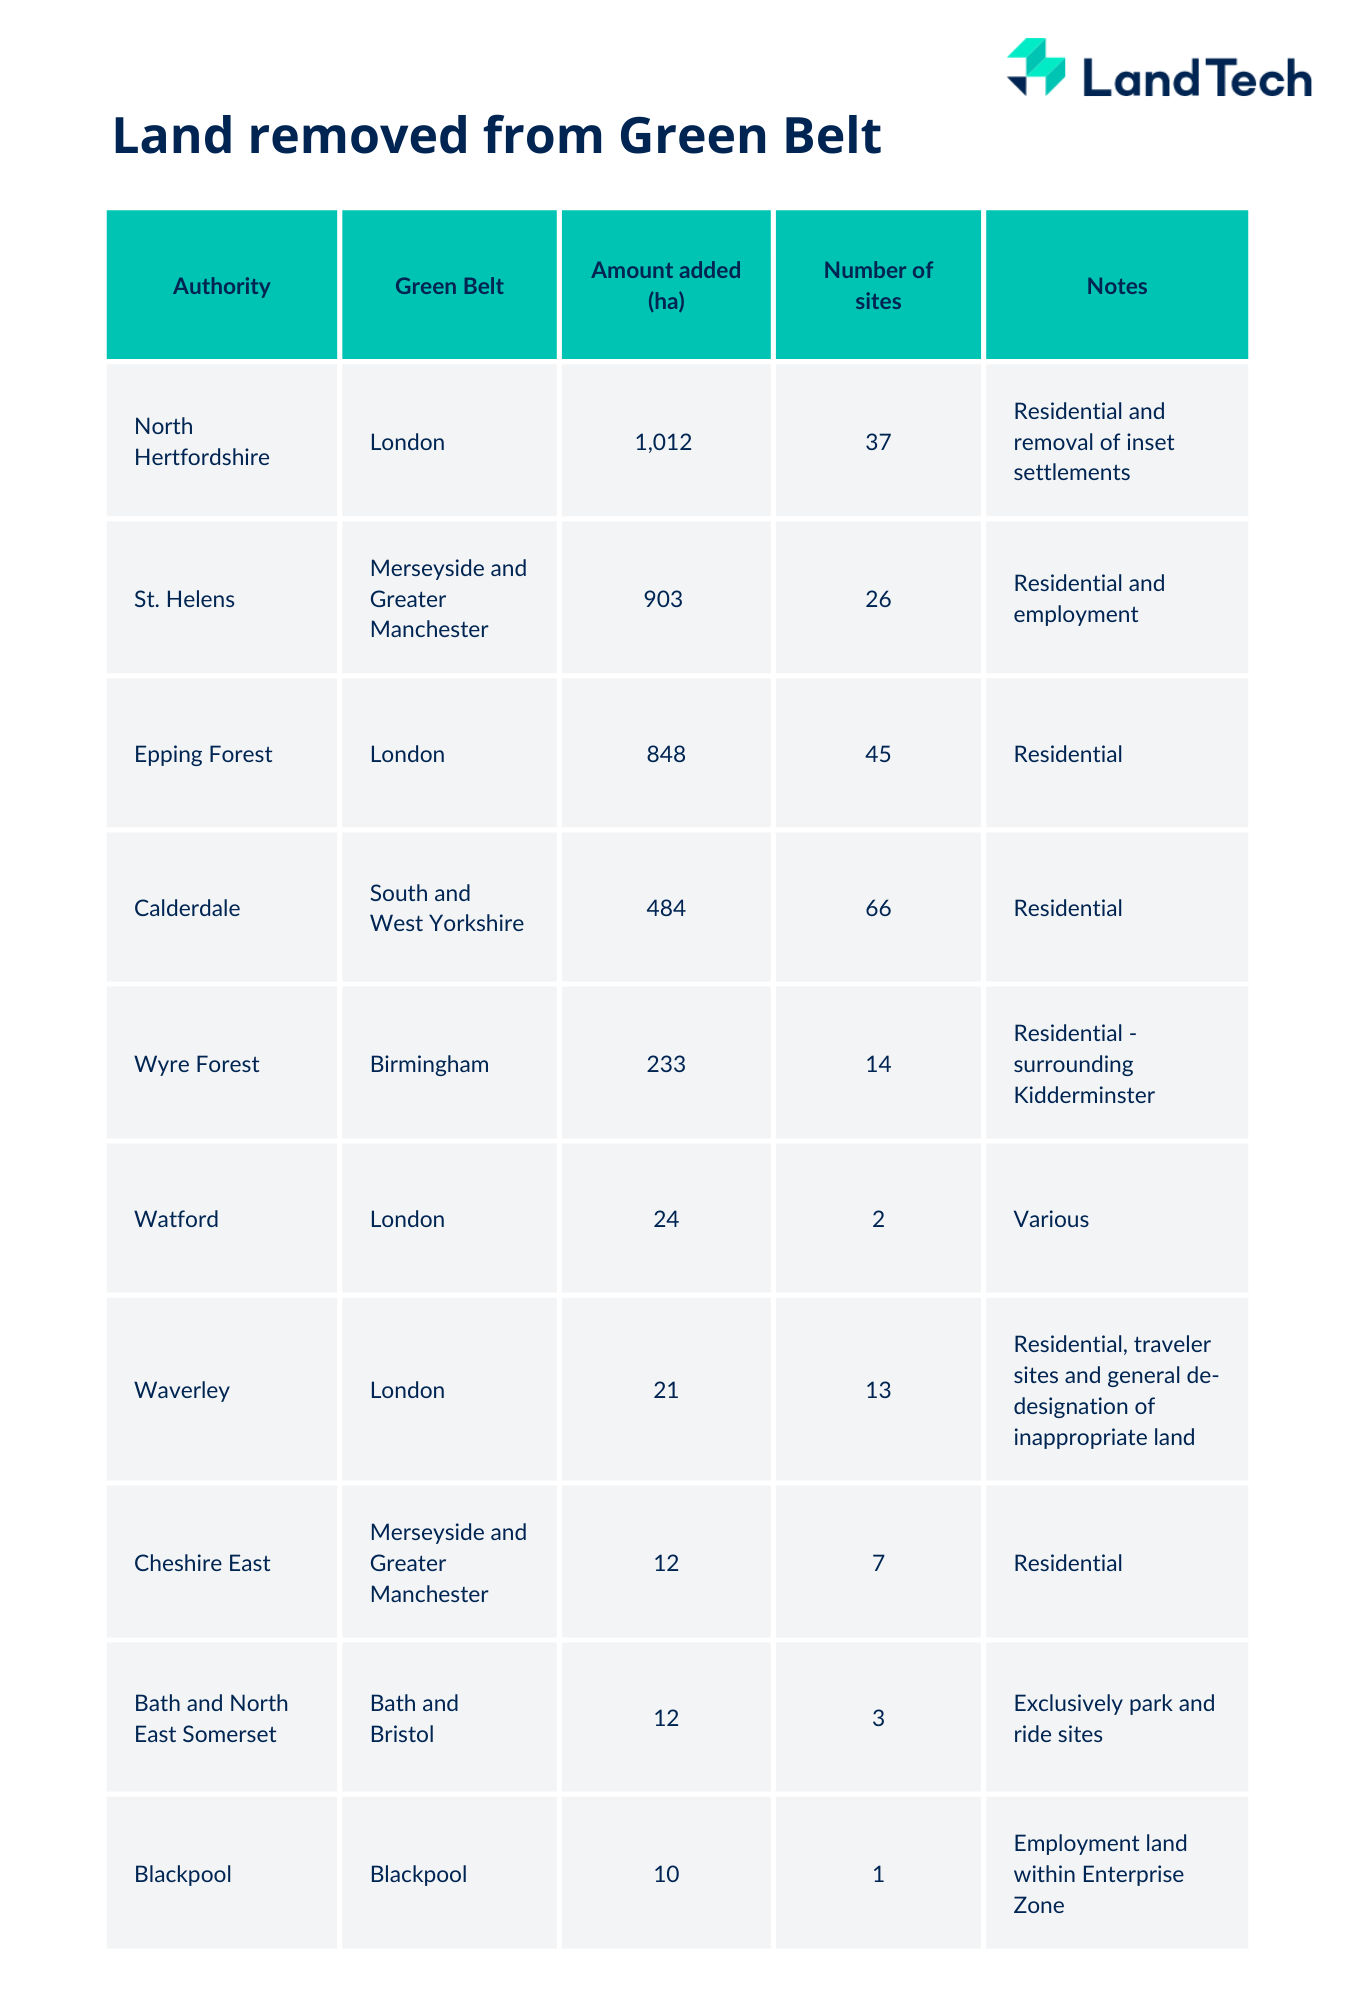
This large addition to the total area of Green Belt has allowed a larger number of authorities to release Green Belt land in strategic locations without reducing the total amount of protected land. Section 8.1. - Annex A of the official statistical release provides further details and explanations of why land has been removed.
In total 3,559 ha of Green Belt has been released. These releases affect the Green Belts around London, Merseyside and Greater Manchester, Birmingham, South and West Yorkshire, Bath and Bristol, and Blackpool.
Source: Gov.uk, LandTech
Analysis of released Green Belt sites
We have looked in more detail at the sites that have been released from the Green Belt to see what these releases are likely to mean for development in the affected areas.
To avoid double-counting the development potential of any already-developed areas, we first calculated the current dwelling density of each site. We selected a density of five dwellings per hectare (dph) as a reasonable indicator of undeveloped land and have assumed that any changes to the Green Belt affecting sites with an existing density above 5dph are likely to indicate a mapping correction by the local authority to exclude existing ‘washed over’ settlements in green belt.
This indicated that 88.5% of all green belt releases affected ‘undeveloped’ sites with a density of less than 5dph.
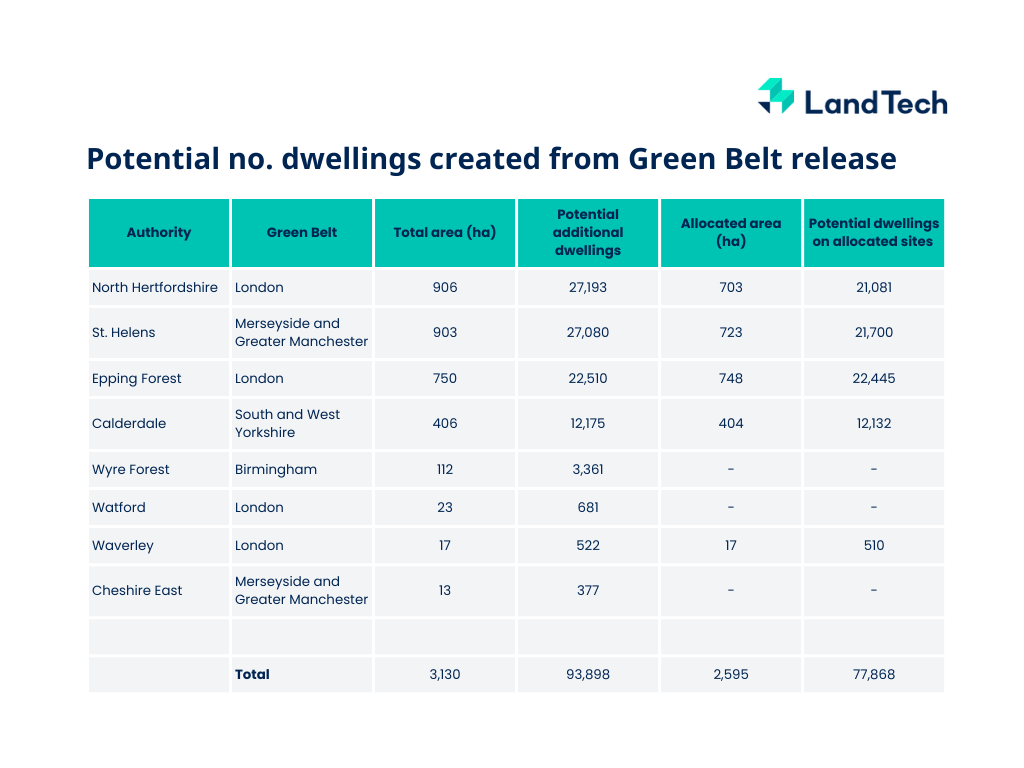
We then looked at whether or not the sites were fully or partly covered by allocations from adopted or emerging plans, and calculated the potential additional dwellings these could accommodate if developed at an average of 30 dph.
The Green Belt releases in Blackpool and B&NES were excluded from this calculation as the Green Belt releases here are exclusively for employment use. Our calculations assume that all land in the Green Belt release could be residential, many of the releases are allocated for mixed uses, so the numbers in this exercise are likely to be towards the top-end of the range.
Source: Gov.uk, ons.gov.uk, LandTech
This analysis shows that, although the headlines surrounding the statistical release for Green Belt land focussed on the overall increase in Green Belt allocation, enough land was released from the Green Belt in England to create nearly 94,000 additional dwellings. Of these, nearly 78,000 are within existing or emerging allocations.
How many people are estimated to live in and near the new Green Belt boundaries?
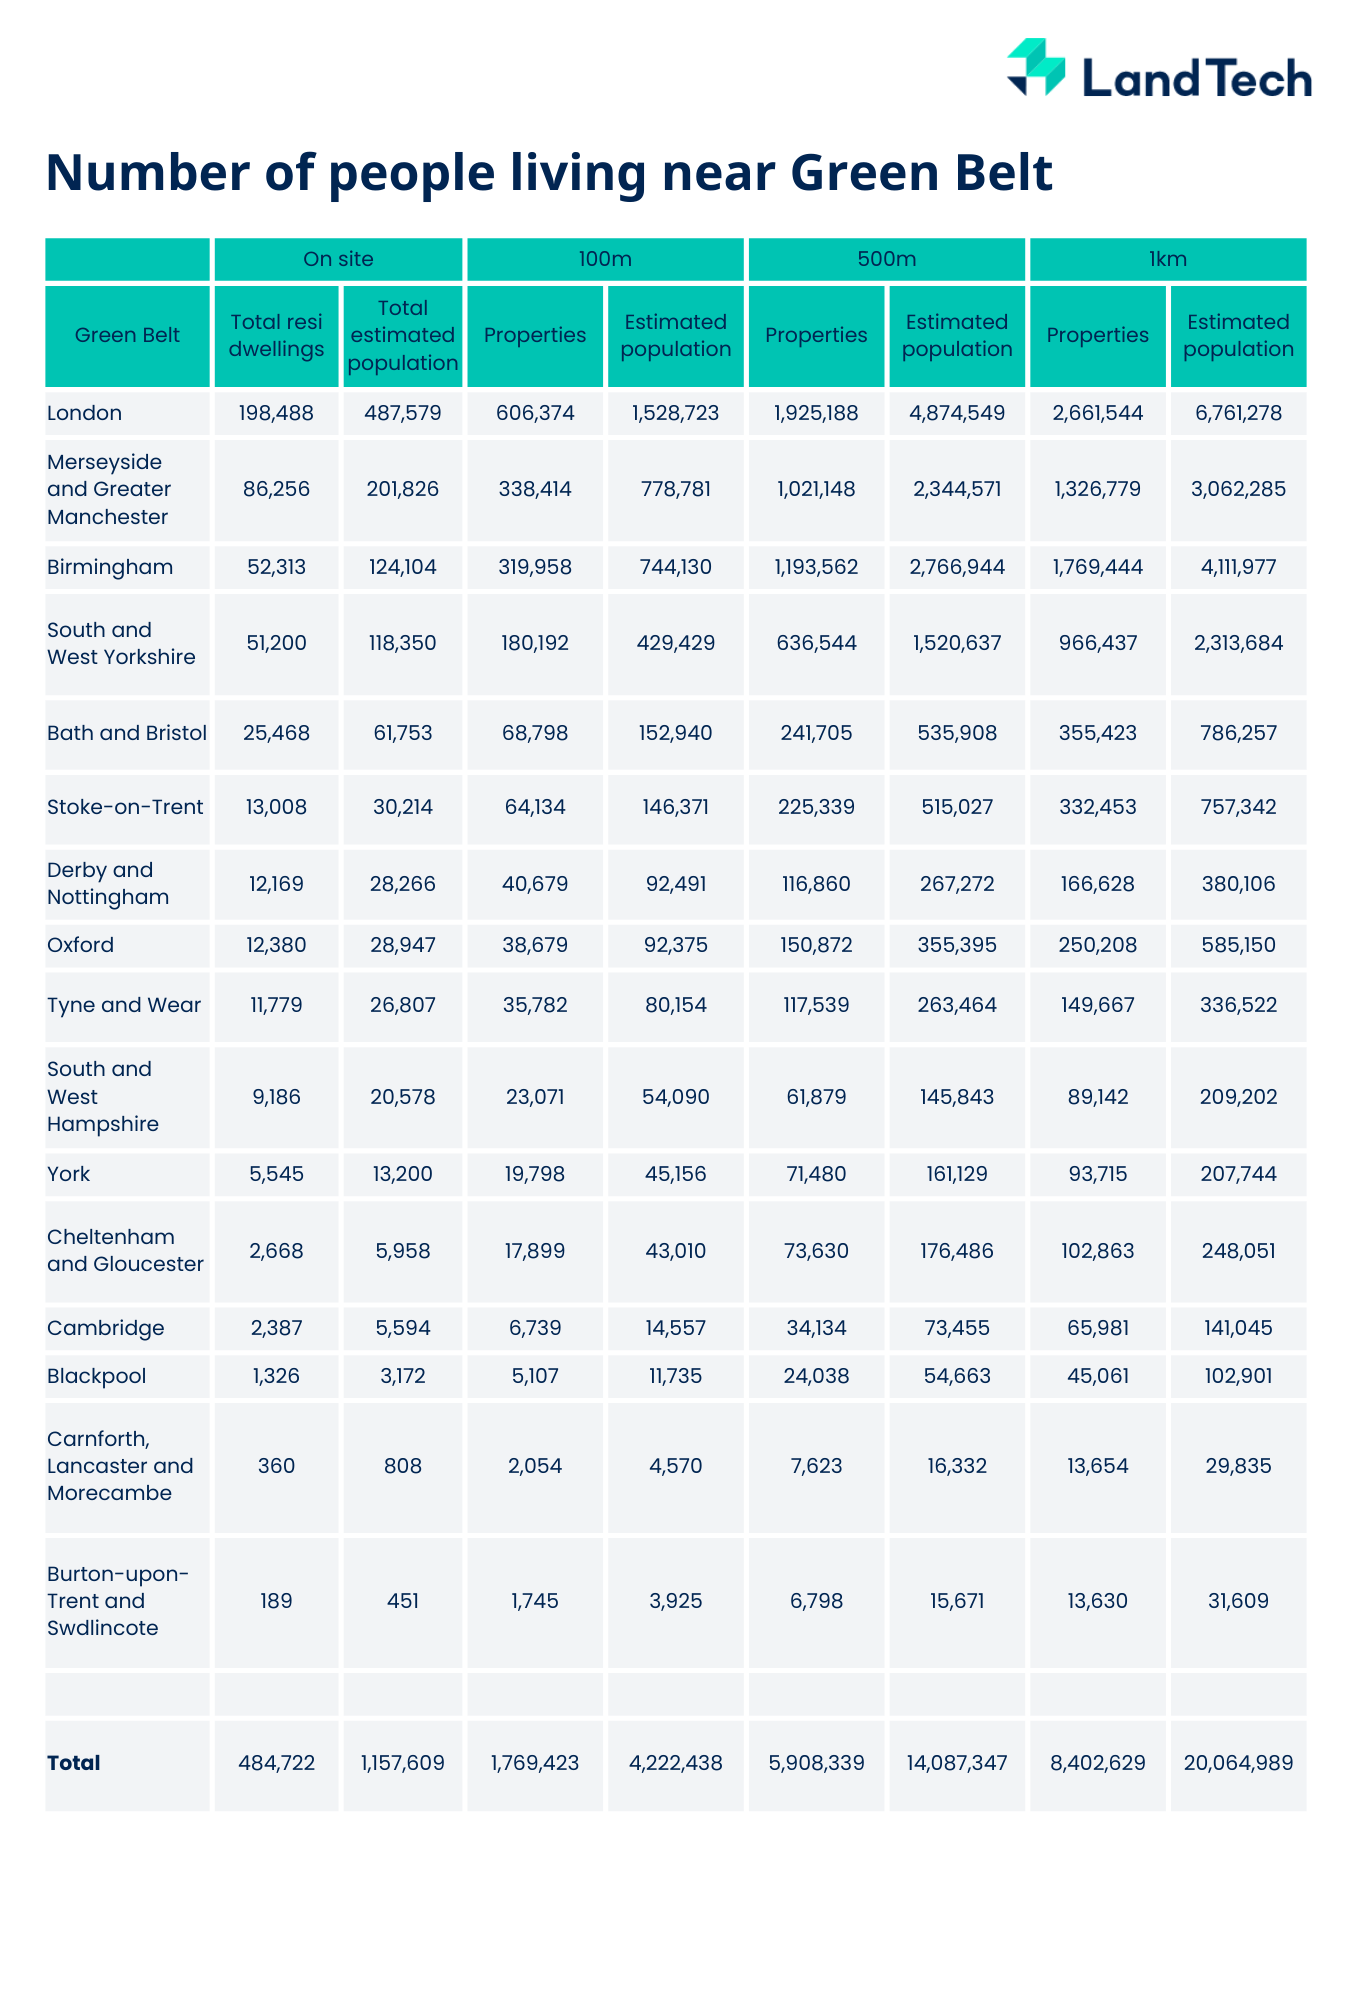
As part of this analysis, we had a look at the existing population density within 1km of the Green Belt to see how many people live close to the areas protected by this designation. This analysis is based on the recorded dwelling occupancy rate in each catchment, and so, gives a fairly accurate indication of the size of our population that is hemmed in by the Green Belt policy.
Our analysis shows that over 1 million people currently live on land that is designated as Green Belt in England. In addition to this, over 20 million people live within 1km of the designated Green Belt. That’s nearly a third of the total population of Great Britain.
Source: Gov.uk, ons.gov.uk, LandTech
What is the Green Belt for?
It may be tempting to think that, for these 20 million people, living within 1km of the Green Belt is a great opportunity to experience the ‘Great Outdoors’. Unfortunately, that’s not usually the case – and a lot of the Green Belt is not even green.
The purposes of the Green Belt are established by the National Planning Policy Framework and are as follows:
- (a) to check the unrestricted sprawl of large built-up areas;
- (b) to prevent neighbouring towns merging into one another;
- (c) to assist in safeguarding the countryside from encroachment;
- (d) to preserve the setting and special character of historic towns; and
- (e) to assist in urban regeneration, by encouraging the recycling of derelict and other urban land.
As you can see there is nothing in there about wildlife, nature, biodiversity, or - importantly - public access. In fact, when you consider that over 65% of the green belt is actually agricultural land, it’s clear that by through the beatification the Green Belt, we’re ring-fencing inaccessible farm land and preventing houses being built in some of the most sustainable locations - near to existing services and transport nodes.
As a developer, this further restricts what you can build where. We write more about developing on the Green Belt in our blog – How to get planning permission in the Green Belt.
Releasing Green Belt for development is still very challenging, but being armed with the right data is the first step to making informed decisions about where you should be building.
Easily check if sites fall in the Green Belt
You can access more information about land that has been released from Green Belt within LandInsight now.
Take a look