
Support for Grey Belt Opportunities by LPA
First, let’s compare general support for development against the size of the “Grey Belt” opportunity, highlighting those local authorities identified by LandTech as either already under, or likely to fall under, the presumption in favour:
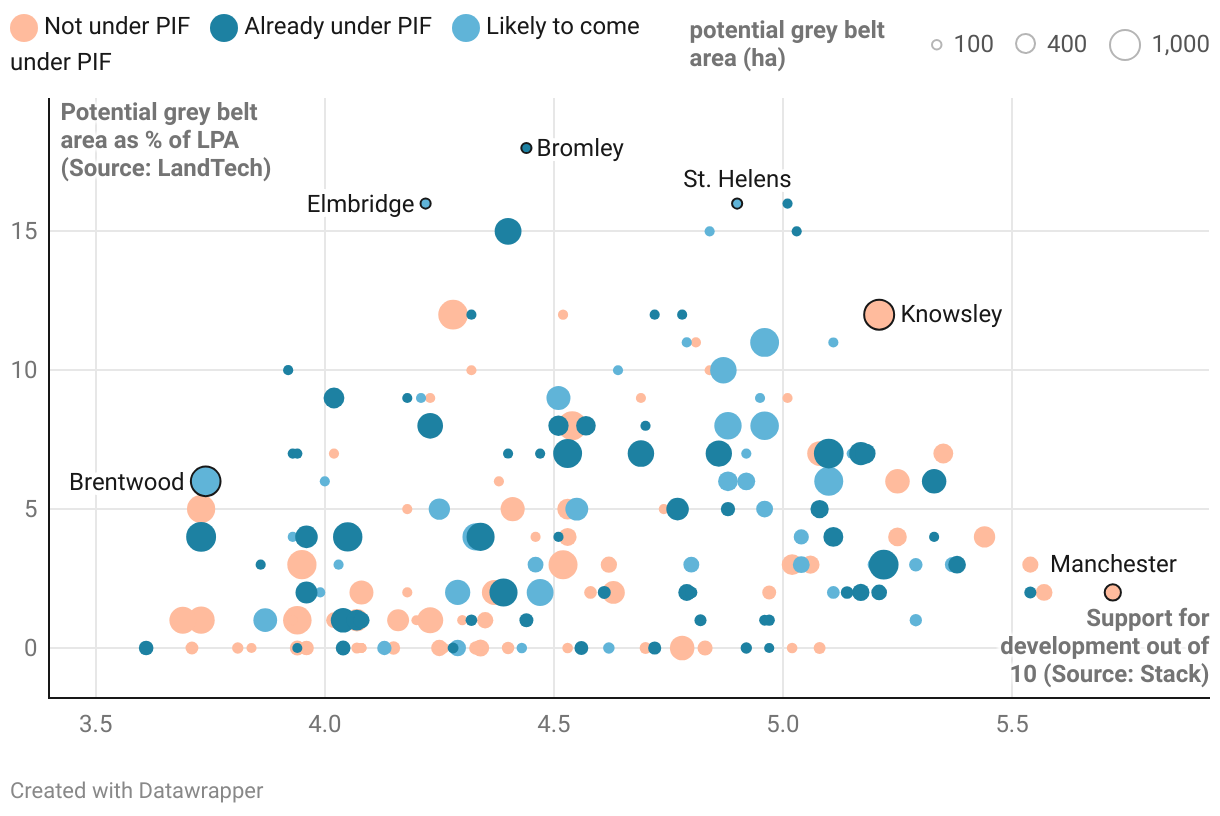
Figure 1. Scatter plot showing support score out of 10 (x, from Stack) and % of the LPA made up of potential Grey Belt (y, from LandTech) by LPA. Each dot is coloured by status in relation to the presumption in favour (LandTech) and the size of each dot represents the no. of hectares of potential Grey Belt (LandTech)
Stack’s “support for development” score is out of 10, and is calculated from survey responses to 10-point scale questions where they ask respondents how likely they would be to support (10) or oppose (0) particular types of development within half-a-mile of where they live. They also ask how likely they would be to contact the council to object to a new development, and incorporate this into the score.
Our data has been used here to signify the size of potential opportunity in each LPA, along with an indication of their likely presumption in favour status under both the 2023 and 2024 version of the NPPF.
The scatter plot shows how average support for development varies across local authorities. For example, at the left-hand end of the spectrum we see places like Uttlesford, Stratford-on-Avon and Harborough where support for development is very low. At the other extreme areas like Manchester, Liverpool, Nottingham and some London Boroughs have relatively very high levels of support for development.
The trend that we can see here indicates that rural areas with older populations (who are also more likely to own a home) are less supportive of development, whilst urban populations which tend to be younger (and are less likely to own a home) are more supportive, which may be unsurprising.
This analysis suggests that developers can be confident of support from a representative group of the local population in Gateshead, Tameside, St Helens, Broxtowe and all the additional LPAs on the right-hand side of the scatter plot.
But what about areas that are less supportive of development, like Tandridge, Wakefield, and Bromley? How can we gain community backing for potential Grey Belt sites in these regions? Stack’s data has also provided an indication regarding the priorities and concerns of people and can help identify where those likeliest to be supportive are concentrated within a local authority, which we’ll review next.
A guide to approaching LPAs with negative sentiments toward Grey Belt developments
While understanding from Stack’s analysis that there are plenty of communities in LPAs that are supportive of Grey Belt developments, it’s important to take a mindful approach when considering Grey Belt sites in areas that aren’t so keen on new housing. Using further insights from Stack’s analysis - specifically using Tandridge, Wakefield and Bromley as an example - we’ve put together a few points to consider when approaching these communities.
Not all developments are created equal
Insights from Stack’s analysis of LandTech’s Grey Belt site data indicate that developments are not created equal when it comes to potential public support: the overall support score combines sentiment about “private family housing”, “a new social housing estate”, “a block of flats” and a number of other types of schemes. In the areas that we looked at the overall support score for “private family housing” is significantly higher than the support seen for other forms of development.
Understanding of the Grey Belt
We can also see that public understanding about what a Grey Belt site actually is varies between areas. While net support for developing local Green Belt land is significantly negative in each area (-47% in Tandridge, -38% in Wakefield, and -34% in Bromley), there is strong net support for developing 'Grey Belt' land. In fact, as Figure 2 shows, support for Grey Belt development approaches levels similar to brownfield land, with over half of residents in these areas backing it.

Figure 2. Relative support for development on Brownfield, Green Belt, and Grey Belt land in three areas
The general understanding about what a Grey Belt site is has evolved since the release of the NPPF. This shows the power of effective messaging when describing a proposed site and why it is an appropriate area development. Developers need to use all the tools at their disposal to educate and inform about the sites they’re looking at to help ensure public support is as wide as possible before a planning application is submitted.
Age isn't always a factor
Interestingly, older people are particularly likely to be supportive of the idea of “Grey Belt” development, reversing the traditional narrative of which demographics will support or oppose new building, as shown in Figure 3.

Figure 3. Support for “building on the Green Belt” and “building on ‘Grey Belt’ land” by age
Considering local priorities
Another lesson we can learn from this analysis is to engage with local priorities. Nationally, when communities were asked about their priorities for investment, “public services” consistently emerged as the top priority. Tandridge, Bromley and Wakefield are no exception, with 60%, 56% and 59% selecting that option.
However, a closer look reveals important local variations. In Tandridge and Bromley, 'housing' is the second priority, chosen by 48% and 54% of residents, respectively. In Wakefield, 'employment' comes second, with 46% selecting it.
The takeaway is clear: local residents need assurance that new development will be supported by investment in public services. In Wakefield, jobs should be a key focus, while in Tandridge and Bromley, highlighting how development can ease housing pressure is likely to gain more support.
This is just one example, but our analysis delves much deeper into local opinion. Understanding these nuanced perspectives invites a richer conversation about how we can collaboratively meet local needs and foster a thriving community.
Effective consultations and messaging: keys to a successful approach to Grey Belt developments
Finally, developers need to ensure they’re asking the right people about their projects, and to ensure that their voices are heard by the decision makers. Using Stack’s data we’ve identified different segments of the population that are more or less open to the idea of new development.
The analysis shows that around 20% of people are strongly anti-development, but the remaining 80% are more divided—some are likely to support new initiatives, while others may be persuaded. This is why it’s critical to ensure that all viewpoints are heard, not just the silent minority.
As we’ve seen through Stack’s analysis, there are varying viewpoints about Grey Belt sites based on everything from knowledge of the definition of the Grey Belt to local priorities and even demographics. This is why effective consultations and messaging are critical to fostering a broader support for new developments to help address the housing crisis.
When you need a local perspective, a digital community engagement tool like Give My View can help developers achieve more effective consultations, reach a wider audience, and achieve more tailored messaging to ensure no voice is left unheard.
If you’re ready to start reviewing Grey Belt sites for your next opportunity, check out our on-demand webinar that showcases LandInsight’s Grey Belt layer, or if you’re ready to engage more meaningfully with the people in your area, and ask them directly about the issues that matter to them, simply request a demo of Give My View below.
